Tech Stack
Python, Pandas, NumPy, Matplotlib, Seaborn, Jupyter Notebook
THE PROBLEM
Public crime data is often available but underutilized due to how raw and unstructured it is. The San Francisco Police Department provides crime records, but they come as large CSV files with inconsistent fields, duplicates, and no immediate visual representation. There was a need for a dashboard that could clean and summarize this data into clear, interactive insights — usable by everyday citizens, journalists, or data enthusiasts.
THE SOLUTION
Built a complete end-to-end crime analysis pipeline, from data cleaning to interactive dashboards.
Key features include:
Data Cleaning – Handled missing values, removed duplicates, standardized columns (date formats, category names)
Time Series Analysis – Trendline of crimes per year/month to detect seasonal patterns.
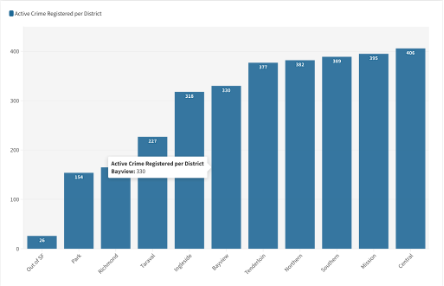
District-Level Insights – Breakdown of crime volume per police district.
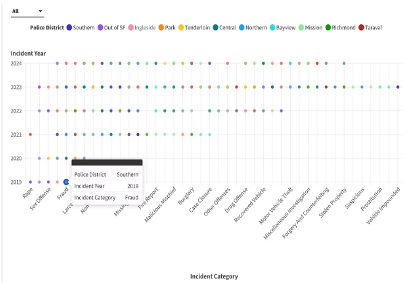
Category-Wise Analysis – Top 10 crime categories, with frequency and monthly spikes.
Hour-Wise Patterns – Visualized crime occurrence by hour of day.
Performance Optimization – Reduced processing time by using vectorized pandas operations.
Matplotlib & Seaborn Visuals – Clean, publication-ready plots for trend exploration
THE OUTCOME
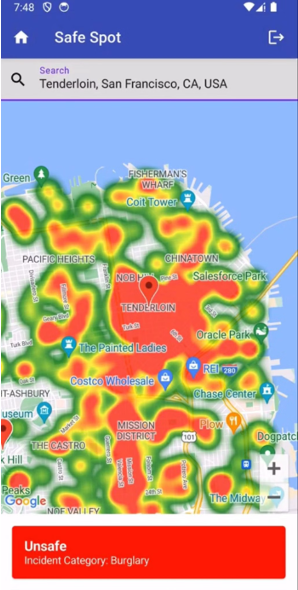
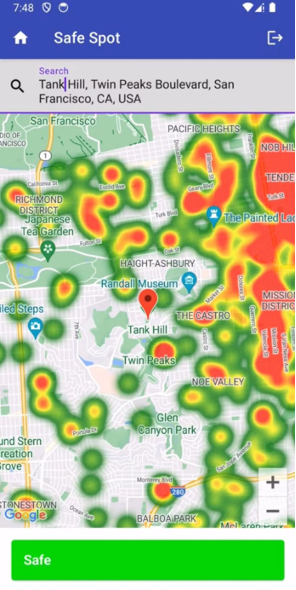
The result is a clean, focused analysis of San Francisco’s crime landscape with visuals that make it easy to spot high-crime districts, time-based trends, and areas for potential intervention SF-Crime Analysis.
This project highlights strong skills in:
Data wrangling & cleaning
Visualization storytelling
Self-driven project planning
Performance-aware Python scripting